

One chart, four ways returns in Chart Chat 70
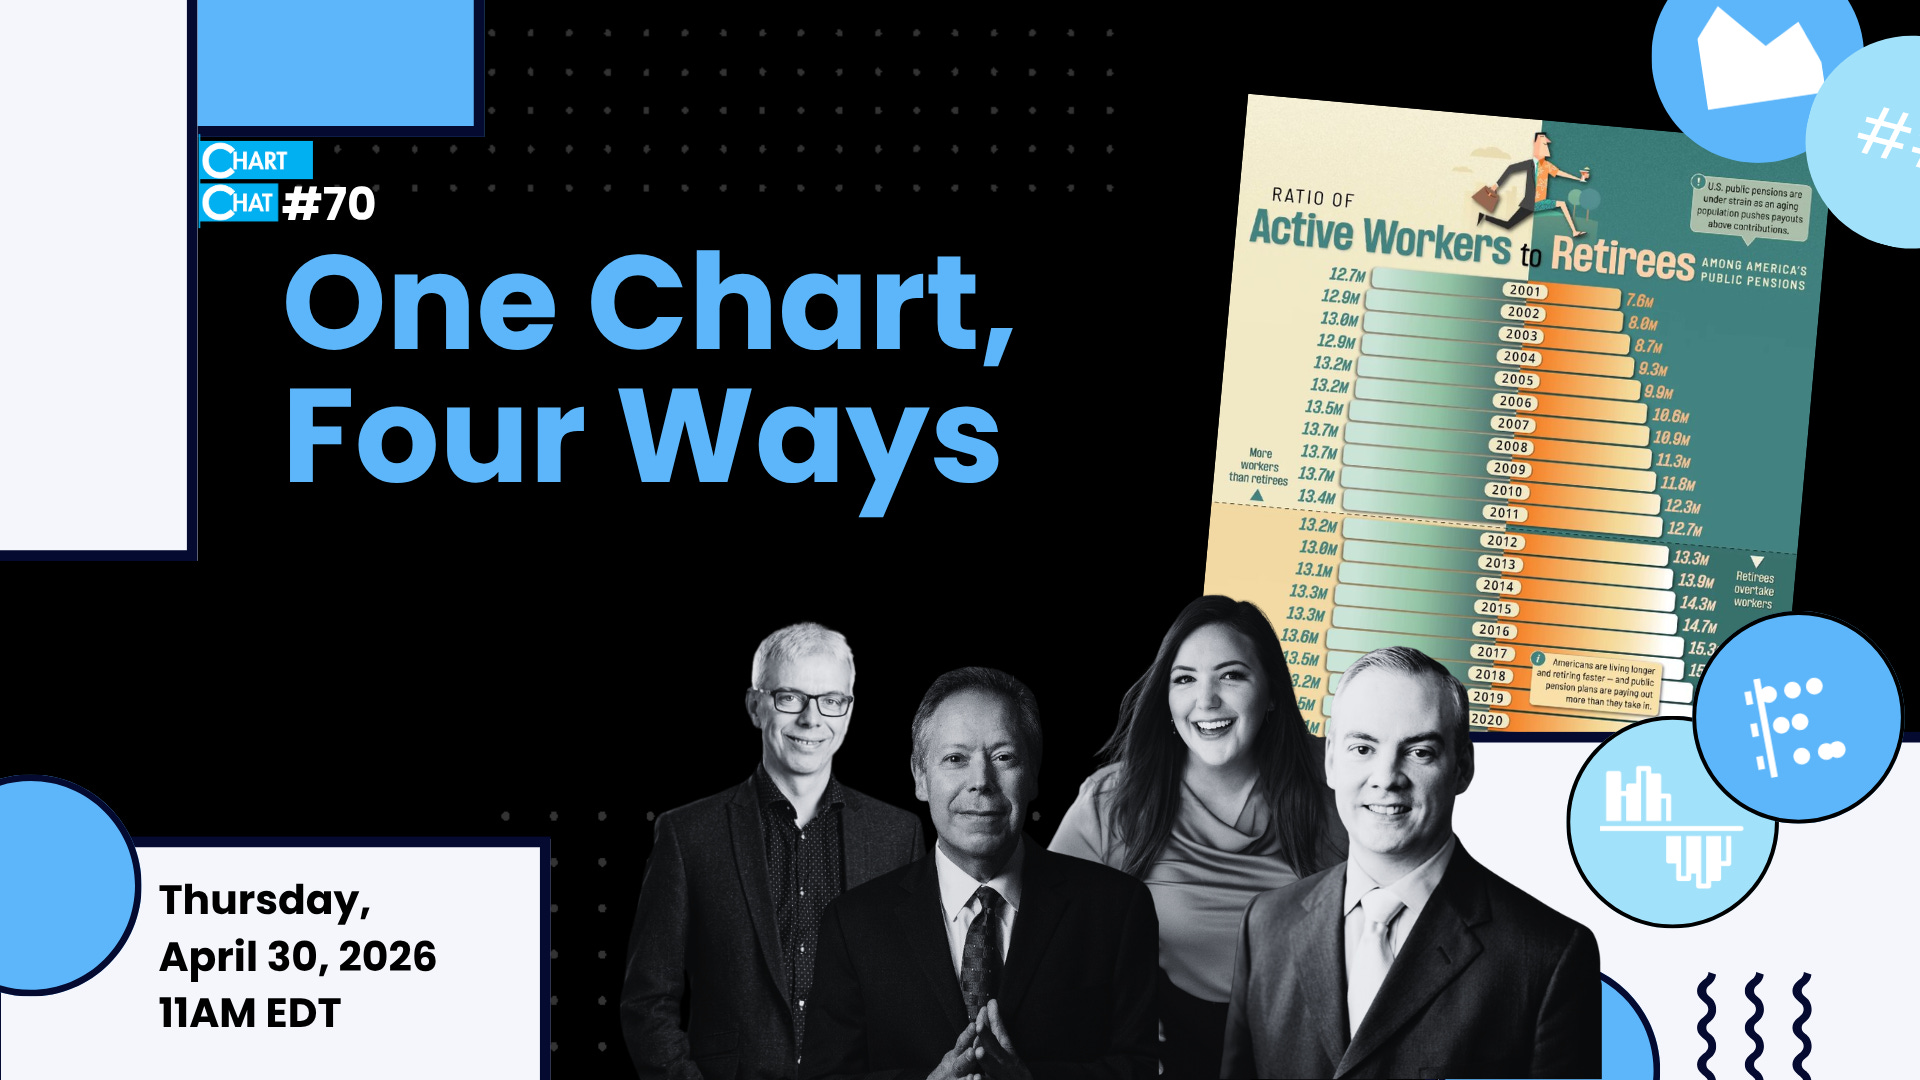
Join us Thursday, April 30 to see how four data experts redesign a chart.

This month we’re hosting the 70th episode of Chart Chat! And to celebrate, we’re hosting one of the fan favorite sorts of episodes: one chart, four ways.
Join us this week Thursday, April 30 at 11AM EDT to see how each of us redesigns a snazzy bar chart of public pension data. You can expect makeovers of the visualization and some pointed questions about the underlying data.
unDUBBED, TC, and other upcoming events
Andy and I hopped on the unDUBBED podcast this month to talk about why dashboards fail. Even if you’ve heard us chat about dashboard-y things before, this conversation with hosts Sarah and Fi was an absolute delight. Give it a listen on your favorite podcast platform.
We’ve heard asks from a few folks if Chart Chat LIVE will be back at the Tableau Conference this year, and unfortunately it wasn’t in the cards thanks to schedule conflicts.
If you’re looking to get your copy of Dashboards That Deliver signed, you can find Jeff at the Tableau Tip Battle (where he’s the reigning champ from 2025).
Over the next few weeks, you can also find us at:
Data Innovation Summit, Stockholm, Sweden - Andy is doing the opening keynote entitled “Why human insight is more important than ever in the age of AI” (there are live and virtual tickets available)
Data Viz for Public Health Workshop (virtual) - Amanda is hosting a virtual workshop over on Maven, designed to teach you how to build better charts with a focus on public health data stories. (Use code vizresponsibly for 50% off the registration fee)
Dreamin’ in Data (Chicago, IL) - Amanda is speaking on the keynote panel around Women Leading in Data and AI and doing a short talk on why visualizing data responsibly is a team sport. Conference is May 19-20, with an optional workshop day on May 21.
We love meeting folks in person, so please say hi if you see us at an event!
Love Chart Chat? Two of the best ways to make sure you don’t miss an episode (and help more people discover our delightful data banter) are sharing these posts and by subscribing to our channel on YouTube.