

Chart Chat 68 & talking about dashboards on the PolicyViz pod
Box plots, data presentations, and a digging into why dashboards fail

This week we’re hosting our monthly Chart Chat on Wednesday, February 25 at 11AM EST. Join us live to dig into two chewy topics by signing up on Eventbrite so you can add Chart Chat to your calendar with all the details on how to join us.
(New to Chart Chat or missed a recent episode? You can find all of our past episodes over on YouTube. Subscribe there and you’ll never miss an episode!)
Topic #1: Box plots
Love them? Hate them? Confused by them?
In case you’re thinking of box plots as squares, a reminder that they’re a classic technique for displaying statistical findings. The range-bar method was introduced by data viz pioneer Mary Eleanor Spear (1952) and the box-and-whisker plot defined by John Tukey (1970), so they’ve been a classic chart option for decades.
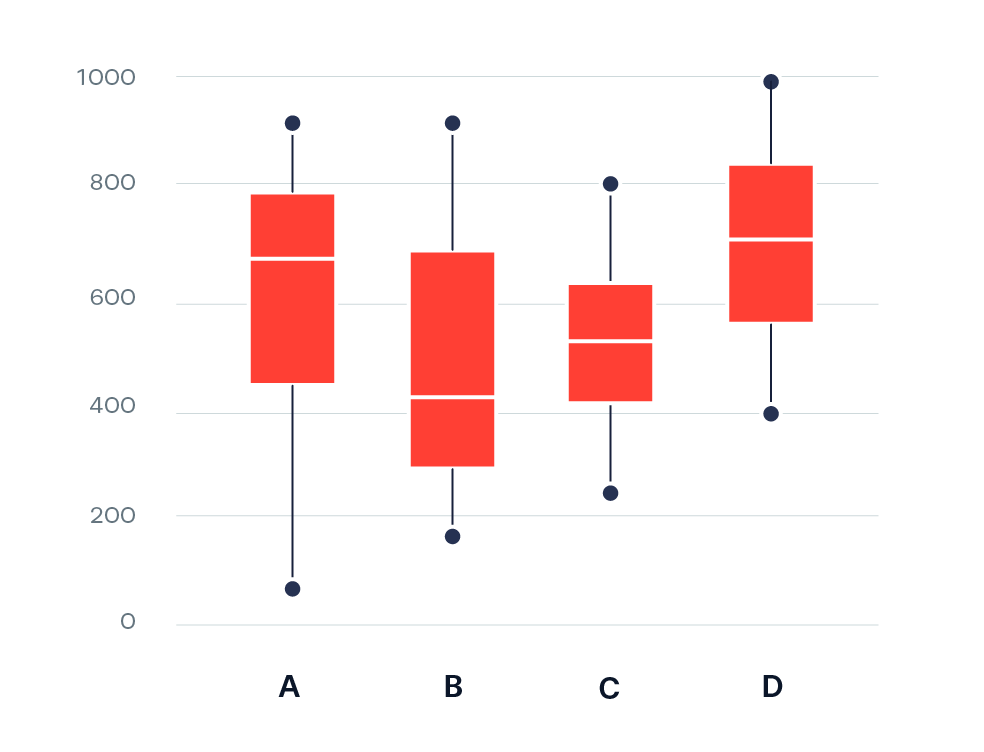
Jeff will break down the basics of the chart components, and then we’ll talk about when we use them (or not). Bring your questions and personal opinions to add them to the chat or to share in our zoom afterparty (which happens after every episode for our live viewers).
Topic #2: How we prep for data talks
After box plots, we’ll give you a behind the scenes look at how we prep for Chart Chat and other data presentations.
Across the four of us, we’ve developed and delivered thousands of talks, classes, workshops, and keynotes, but each has our own approach to get ready to deliver a world-class talk.
This topic originated when Steve asked us about it on one of our regular catchups—where many great ideas come from—and we put a pause on the discussion so we could talk it through live with you.
Talking about dashboards on PolicyViz with Jon Schwabish
On last week’s episode of the PolicyViz Podcast, Amanda chatted with Jon Schwabish about why dashboards fail and design tips for building dashboards users actually want to use.
The pod hits on ideas from our book, Dashboards That Deliver, and Amanda’s own experience building dashboards.
You can watch the pod on YouTube or find it on your favorite podcast app. Jon writes The PolicyViz Newsletter, which is another great resource for learning about data viz.
Don’t forget to sign up for Chart Chat this Wednesday, and if you’re new to the Chart Chat newsletter, subscribe so you don’t miss any of our data viz wisdom.